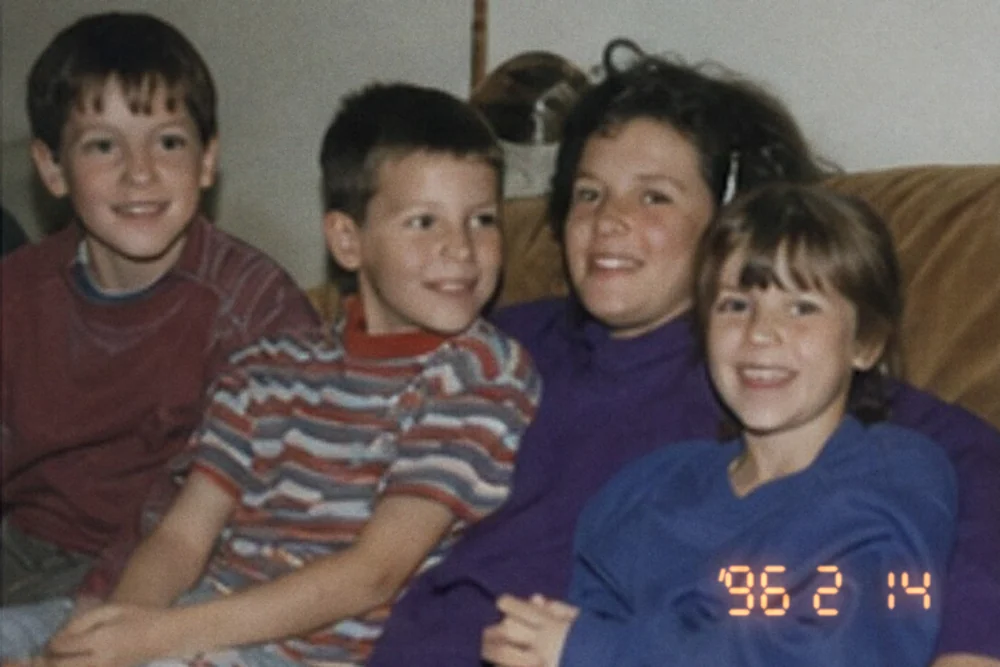
 date on the print
The photo shows its date
An orange corner date, a lab stamp on the back, or a handwritten note.
96 to 99%land within a year of the true date
- 1 monthtypical miss, on average
- 95 to 99%in the right order
Measured accuracy
One thing decides it: does the photo show its date? Here is the short answer. Every number behind it is further down the page.
When a photo shows its date, our AI almost always gets the year right. When it doesn’t, most photos still land close, and tagging your family’s faces closes much of the gap.
date on the print
An orange corner date, a lab stamp on the back, or a handwritten note.
96 to 99%land within a year of the true date
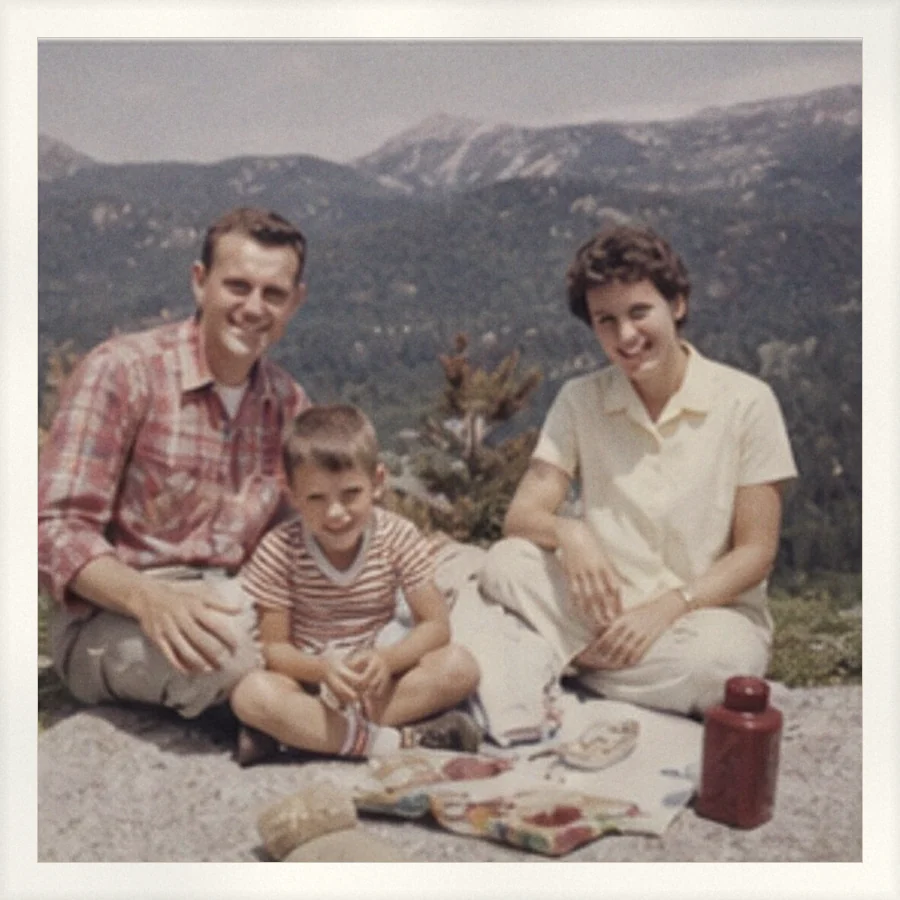 no date anywhere
Uploaded just as they are, in no particular order. The most common box, and the hardest.
83%land within five years of the true date
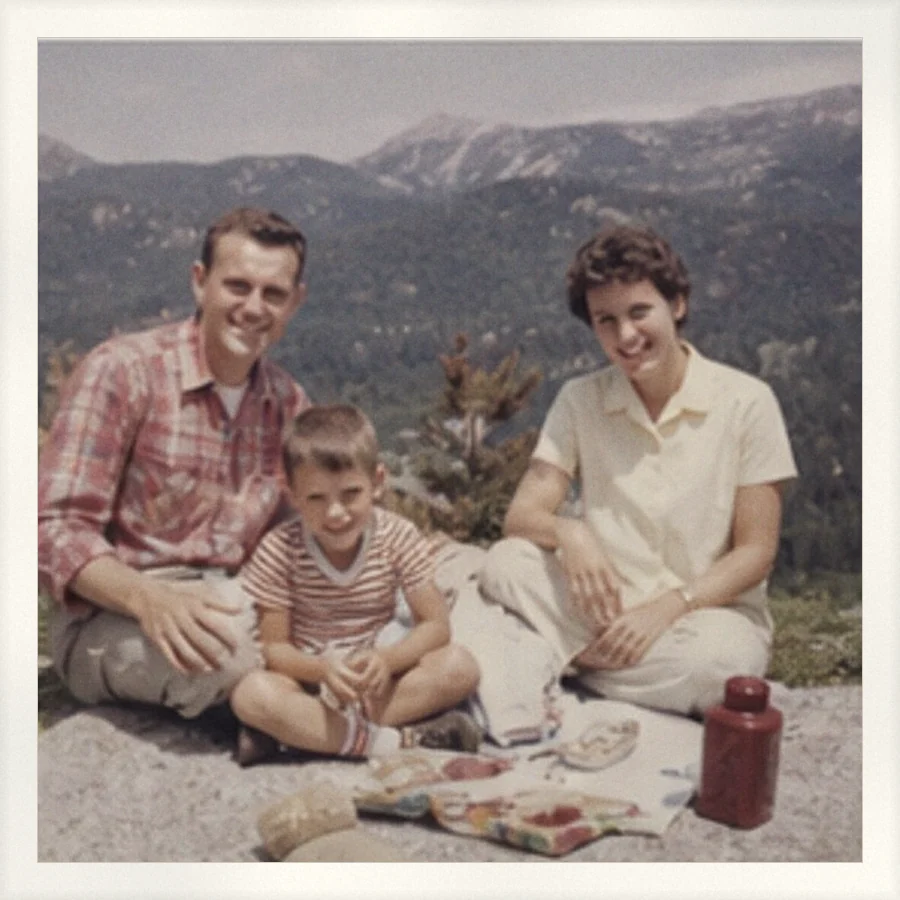 Ray, born 1932
Danny, born 1962
Joan, born 1935
Ray, born 1932
Danny, born 1962
Joan, born 1935
Name a face once and add a birth year. The photo itself needs nothing written on it.
91%land within five years of the true date
In one sentence: prints that carry a date land 95 to 99% of photo pairs in the right order and 96 to 99% within a year of the true date; bare prints in no particular order land 77% of photo pairs in the right order and 83% within five years, and 82% and 91% once faces are tagged. Measured on 1,300 scanned prints with true dates from 1986 to 2005, verified by a person, five runs each. Example scans are illustrative: a generated sample family with invented dates. The benchmark prints are private family archives and are never shown.
Every benchmark at once. Find your row, then read across: three bars per chart, always in the same order.
| What your prints carry | In the right orderof photo pairs | Within 1 yearof photos | Within 2 yearsof photos | Within 5 yearsof photos | Within 10 yearsof photos | Typical missyears, lower is better |
|---|---|---|---|---|---|---|
| The print carries a dateRead off the print itself, front or back. Family information changes nothing measurable here. | ||||||
|
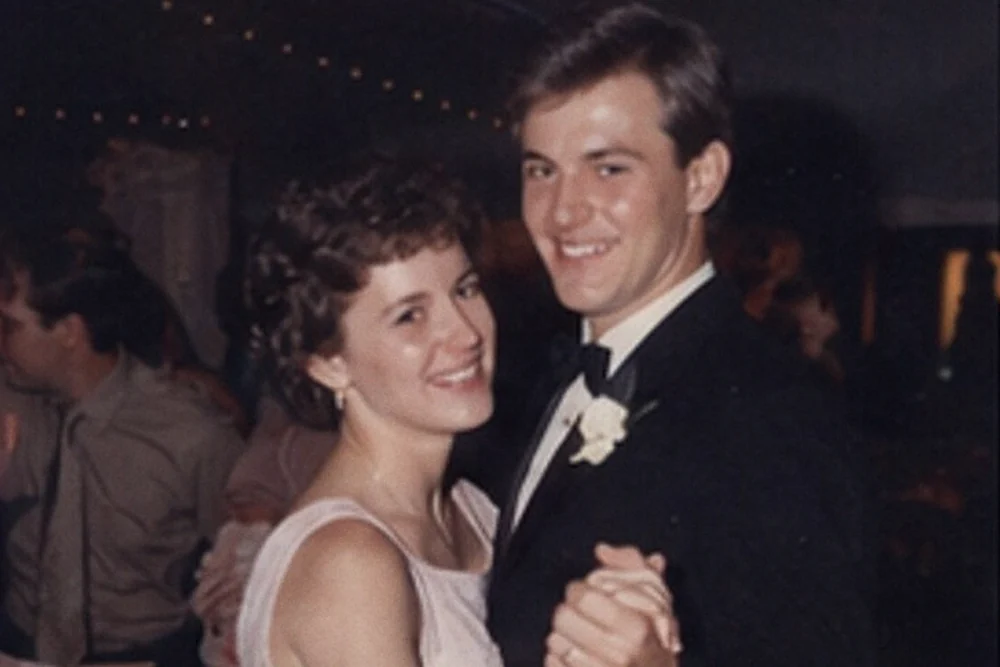
A date on the front
The orange date a camera burned into the corner of the print.
date on the front
|
||||||
A lab date on the back
The date the photo lab machine-printed on the back when it developed the roll.
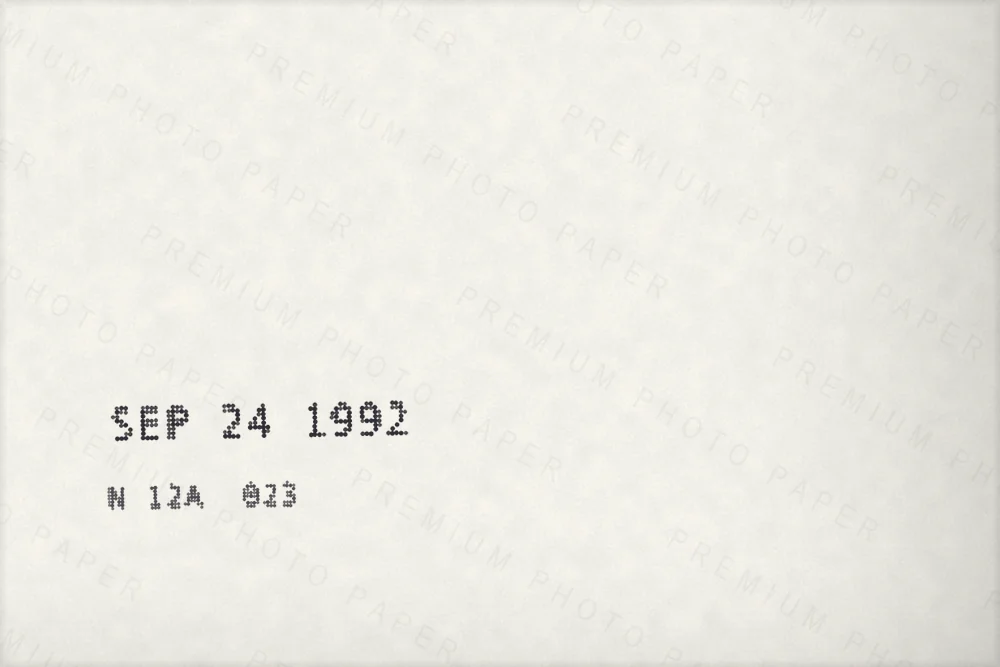 date on the back date on the back
 the front the front
|
||||||
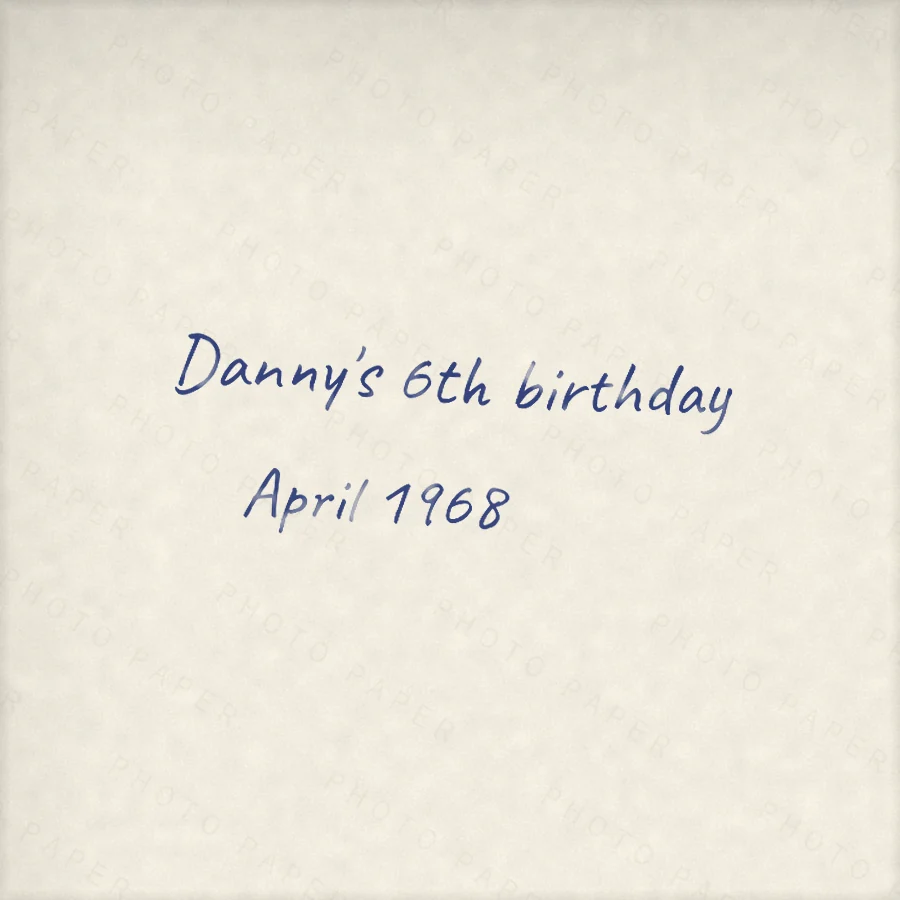
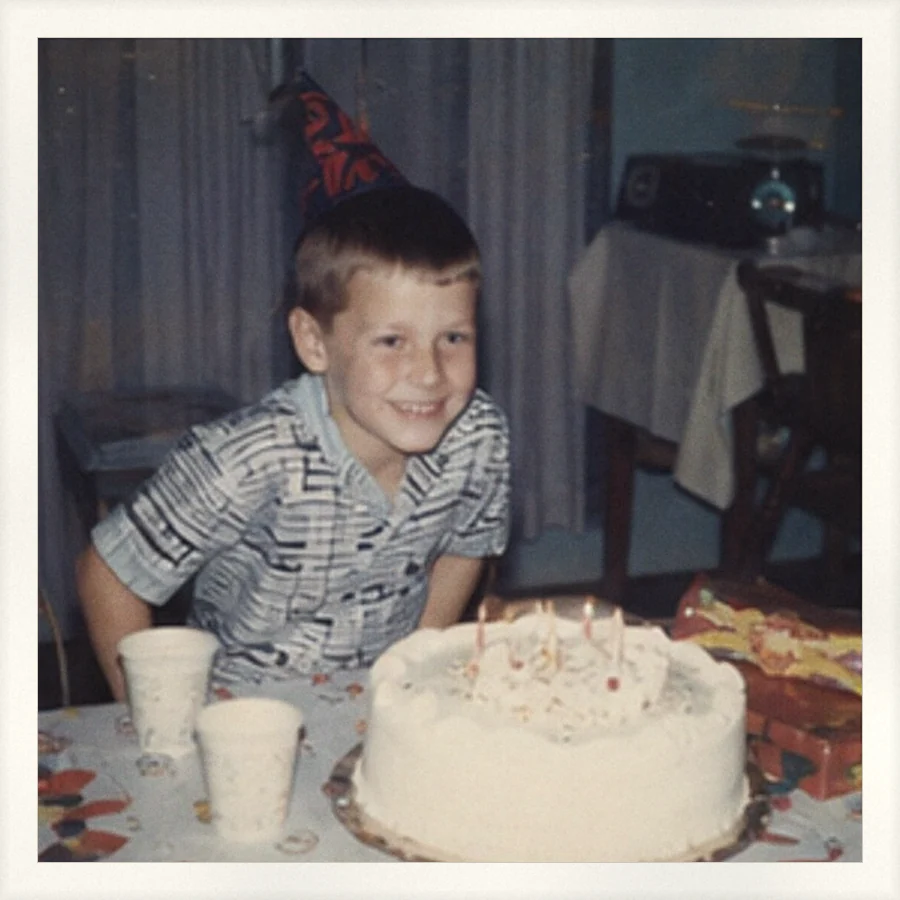
A note on the back
Someone wrote the occasion, or the month and year, on the back in pen.
 note on the back note on the back
 the front the front
|
||||||
| Nothing on the print carries a dateThe year has to come from the picture. This is where tagging faces pays. | ||||||
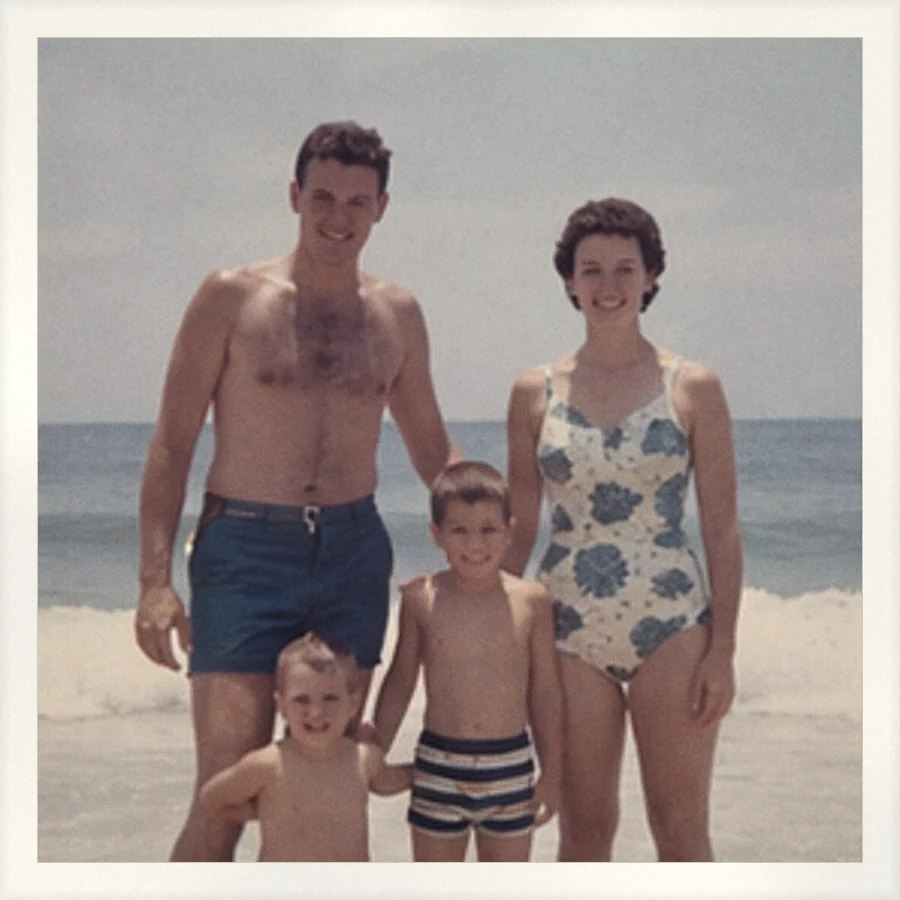
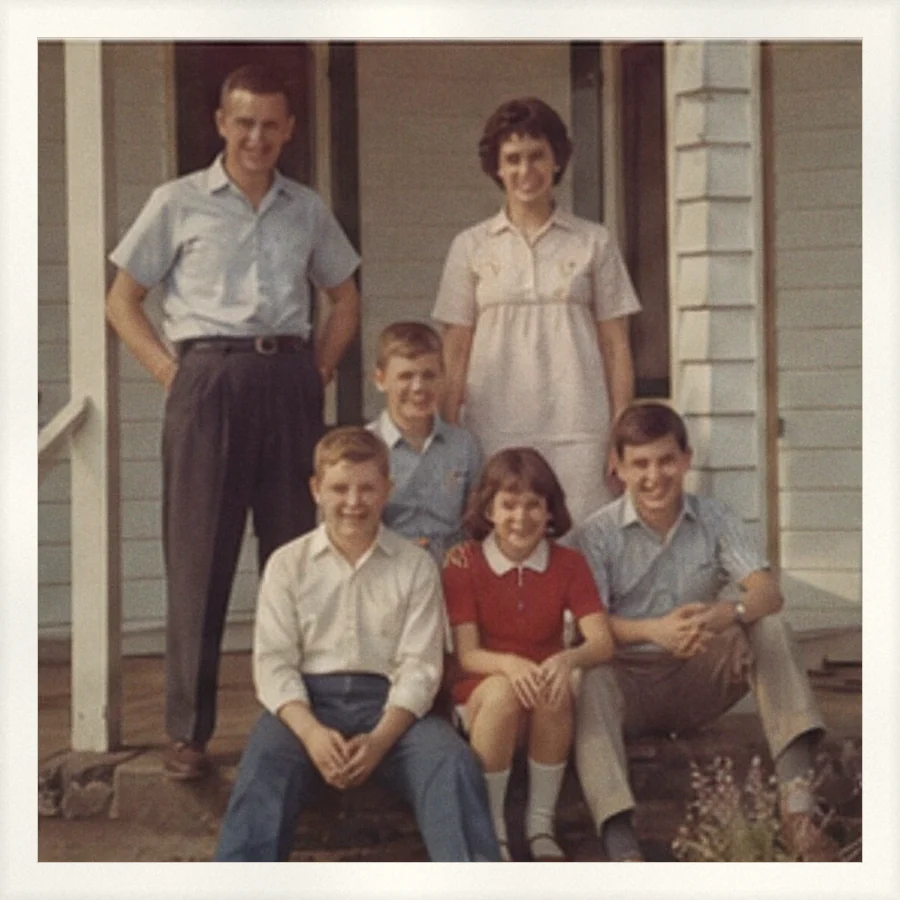
Bare prints, album order kept
Nothing on the front, nothing on the back, but each album was scanned in page order.
 1st 1st
 2nd
3rd 2nd
3rd
 4th 4th
|
||||||
|
The most common archive
Bare prints, no order
Nothing on the front, nothing on the back, and they go in as they come out of the box.
3rd
1st
4th
2nd
|
||||||
Every figure is the mean of five runs over the same frozen prints, scored against dates a person verified. Point at any bar (or tab to it) for the full reading. Measurement ranges add the 95% interval and the spread across the five runs. Example scans are illustrative: a generated sample family with invented dates.
Three bars per benchmark, always left to right: no family information, a typed family roster, faces tagged. The number above each bar is its score.
Take any two photos with different true dates. It counts when the delivered timeline puts the earlier one first.
Mean absolute error: how far our date lands from the true date on average, counting early and late the same.
Percentage points, printed under the bar that earned them. Going from 31% within a year to 53% is a gain of 22 points, marked +22.
The change was smaller than the measurement error across five runs, so we do not claim it. Those bars are hatched, marked with an equals sign, and drawn level with the no-information bar.
Coverage was 100% in every row, arm and run. A skipped photo would have counted as a miss.
Three kinds of box, three answers.
Rows 1 to 3. A typed roster and full face tagging both landed inside the measurement error.
Type a roster if you like. It will not hurt, and it is ready if you add undated prints later.
Names and birth years, typed into a form. No faces picked out, no biometrics.
Every one of those moves sits inside the error bars, so we report no demonstrated difference. It is the seed list for tagging.
Name a person once, add their birth year, and every photo they appear in gains an anchor: who is there and how old they look.
All four gains held in every one of the five runs. Face grouping asks for your consent first, and new tags trigger an included re-check of the dates you already have.
The form appears when you confirm an upload. Skip it and it is offered again with your results, where an included re-check applies it. List the people who are actually in the prints.
Ray, born 1932
Danny, born 1962
Joan, born 1935
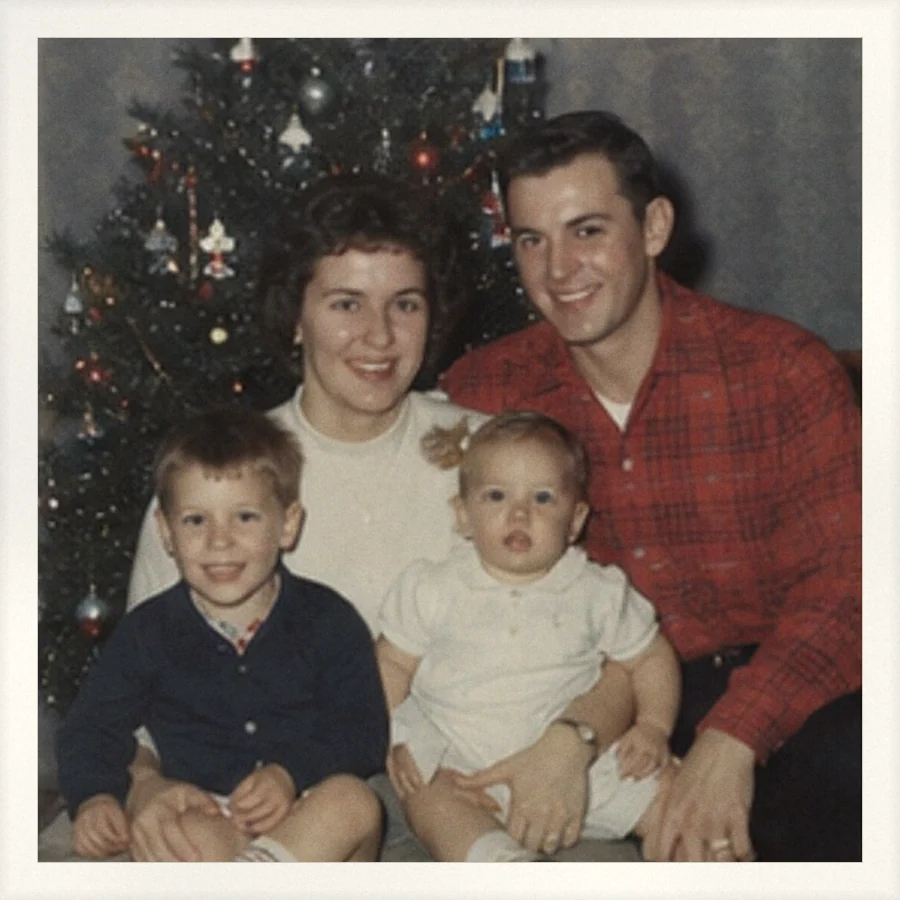
The same bare print as row 5. A boy who reads as about seven, born in 1962, puts it in 1969, and the adults agree. Both apps ask for your consent before any face is grouped.
The same 400 bare prints, run in page order and shuffled. Keeping the order protects against the big misses, in every one of the five runs. Exact years barely move (37% versus 31% within a year, inside the error).
Remember when one photo was taken? Pin it. After dating finishes, the app asks whether you know the year of a few photos spread across your timeline; a rough year is plenty, and the estimates around each answer are re-tuned at no charge. Measured in August 2026 on an earlier 200-print album-order set, not the matrix above: six pinned years took the exact-year rate from 42% and 59% to 94% and 82% in two runs and cut wrong-decade placements to about 2%. Those figures belong to that older set.
Turning a scan right side up is a separate job from dating it, measured separately. One detector does it everywhere: the web service, the iPhone app, and our free FrontBack Scanner. It reads each print in all four quarter-turns before deciding, so a hard photo gets four opinions instead of one.
Measured on 1,000 scanned prints from the same family archives: 500 left exactly as they came off the flatbed and 500 given random quarter-turns. When the detector cannot tell (a dark frame with no vertical reference), it keeps the scan as you laid it rather than guess, with a one-click rotate in the preview either way. Built on the MIT-licensed deep-image-orientation-detection model by Duarte Barbosa. Last re-measured June 2026.
For comparison, MyHeritage reports about 60% of PhotoDater’s estimates within 5 years of the actual date. Ours is 99% or better when the print carries a date, 83% on bare prints in no order, and 91% once faces are tagged. Every photo-dating number depends on how much evidence the photos carry; our side-by-side comparison covers when each tool fits.
The free photo trial exists so you can judge the dating on your own scans before paying anything.
Curious about a single print first? The free what year was this photo taken checker estimates a year for one photo, no account needed.
Try It Free